Guides: deploy & operate
How to monitor with Prometheus and Grafana
This guide shows you how to scrape DeltaGlider Proxy with Prometheus, build the Grafana panels that matter, and install the alert rules you actually want to be paged on. The full metrics catalog lives in the metrics reference.
Three always-on endpoints are exempt from SigV4 auth so monitoring systems can hit them without credentials: GET /_/health (status + cache/RSS gauges), GET /_/stats (aggregate storage stats, 10s server-side cache), and GET /_/metrics (Prometheus text format). The version is intentionally not in /_/health (anti-fingerprinting); the authenticated GET /_/api/whoami returns it.
1. Configure the scrape#
# prometheus.yml
scrape_configs:
  - job_name: deltaglider
    metrics_path: /_/metrics
    scrape_interval: 15s
    static_configs:
      - targets: ["s3.acme.example:9000"]
For multiple instances, use service discovery or list each target directly:
scrape_configs:
  - job_name: deltaglider
    metrics_path: /_/metrics
    scrape_interval: 15s
    static_configs:
      - targets:
          - "dgp-1:9000"
          - "dgp-2:9000"
          - "dgp-3:9000"
The /_/metrics endpoint is exempt from SigV4 auth, so Prometheus doesn't need credentials. Bare /metrics is part of the S3-compatible namespace — do not scrape it.
If you don't have a Prometheus + Grafana stack yet, this starter compose gets you one:
services:
  prometheus:
    image: prom/prometheus:latest
    volumes:
      - ./prometheus.yml:/etc/prometheus/prometheus.yml
    ports:
      - "9090:9090"

  grafana:
    image: grafana/grafana:latest
    ports:
      - "3000:3000"
    environment:
      - GF_SECURITY_ADMIN_PASSWORD=admin
    volumes:
      - grafana-data:/var/lib/grafana

volumes:
  grafana-data:
docker compose up -d, open http://localhost:3000 (admin/admin), add Prometheus as a data source at http://prometheus:9090, then import the panels below.
2. Build the dashboard panels#
Request rate by operation — time series, stacked; shows which S3 operations dominate:
sum by (operation) (rate(deltaglider_http_requests_total[5m]))
Latency p50 / p95 / p99 — three queries on one panel, unit seconds:
histogram_quantile(0.50, sum by (le) (rate(deltaglider_http_request_duration_seconds_bucket[5m])))
histogram_quantile(0.95, sum by (le) (rate(deltaglider_http_request_duration_seconds_bucket[5m])))
histogram_quantile(0.99, sum by (le) (rate(deltaglider_http_request_duration_seconds_bucket[5m])))
Latency by operation (p95) — spots slow operations; GET (delta decode) vs HEAD (cache read) have very different profiles:
histogram_quantile(0.95, sum by (le, operation) (rate(deltaglider_http_request_duration_seconds_bucket[5m])))
Error rate — stat panel, unit percent (0–1):
sum(rate(deltaglider_http_requests_total{status=~"5.."}[5m]))
  /
sum(rate(deltaglider_http_requests_total[5m]))
Delta compression effectiveness:
# Bytes saved per second
rate(deltaglider_delta_bytes_saved_total[5m])

# Cumulative bytes saved
deltaglider_delta_bytes_saved_total

# p50 compression ratio (lower is better; 0.1 = 90% saved)
histogram_quantile(0.50, rate(deltaglider_delta_compression_ratio_bucket[1h]))
Storage decisions mix — pie chart; delta vs passthrough vs reference split:
sum by (decision) (rate(deltaglider_delta_decisions_total[5m]))
Cache hit ratio — gauge, target > 90%:
rate(deltaglider_cache_hits_total[5m])
  /
(rate(deltaglider_cache_hits_total[5m]) + rate(deltaglider_cache_misses_total[5m]))
Cache headroom — compare cache_size_bytes against DGP_CACHE_MB * 1048576:
deltaglider_cache_size_bytes
deltaglider_cache_entries
Codec pressure — gauge; at 0, all xdelta3 permits are in use and encode/decode queue (raise DGP_CODEC_CONCURRENCY):
deltaglider_codec_semaphore_available
Encode + decode latency (p95):
histogram_quantile(0.95, rate(deltaglider_delta_encode_duration_seconds_bucket[5m]))
histogram_quantile(0.95, rate(deltaglider_delta_decode_duration_seconds_bucket[5m]))
Auth failure rate — a spike in invalid_signature = client misconfiguration; a spike in missing_header = unauthenticated probes:
sum by (reason) (rate(deltaglider_auth_failures_total[5m]))
Uptime:
time() - process_start_time_seconds
3. Install the alerting rules#
Drop these into your Prometheus rules.yml. Tune thresholds to your SLO.
groups:
  - name: deltaglider
    rules:
      - alert: DeltaGliderHighErrorRate
        expr: >
          sum(rate(deltaglider_http_requests_total{status=~"5.."}[5m]))
          / sum(rate(deltaglider_http_requests_total[5m])) > 0.05
        for: 5m
        labels: { severity: warning }
        annotations:
          summary: "DeltaGlider error rate above 5%"

      - alert: DeltaGliderSlowRequests
        expr: >
          histogram_quantile(0.95,
            sum by (le) (rate(deltaglider_http_request_duration_seconds_bucket[5m]))
          ) > 2
        for: 10m
        labels: { severity: warning }
        annotations:
          summary: "DeltaGlider p95 latency above 2s"

      - alert: DeltaGliderLowCacheHitRatio
        expr: >
          rate(deltaglider_cache_hits_total[15m])
          / (rate(deltaglider_cache_hits_total[15m]) + rate(deltaglider_cache_misses_total[15m]))
          < 0.5
        for: 15m
        labels: { severity: warning }
        annotations:
          summary: "Reference cache hit ratio < 50% — consider raising DGP_CACHE_MB"

      - alert: DeltaGliderCodecSaturated
        expr: deltaglider_codec_semaphore_available == 0
        for: 5m
        labels: { severity: warning }
        annotations:
          summary: "All codec slots busy for 5+ minutes — consider raising DGP_CODEC_CONCURRENCY"

      - alert: DeltaGliderAuthFailureSpike
        expr: sum(rate(deltaglider_auth_failures_total[5m])) > 1
        for: 5m
        labels: { severity: warning }
        annotations:
          summary: "Sustained auth failures (> 1/s for 5 min)"

      - alert: DeltaGliderDown
        expr: up{job="deltaglider"} == 0
        for: 2m
        labels: { severity: critical }
        annotations:
          summary: "DeltaGlider instance unreachable"
The built-in admin dashboard#
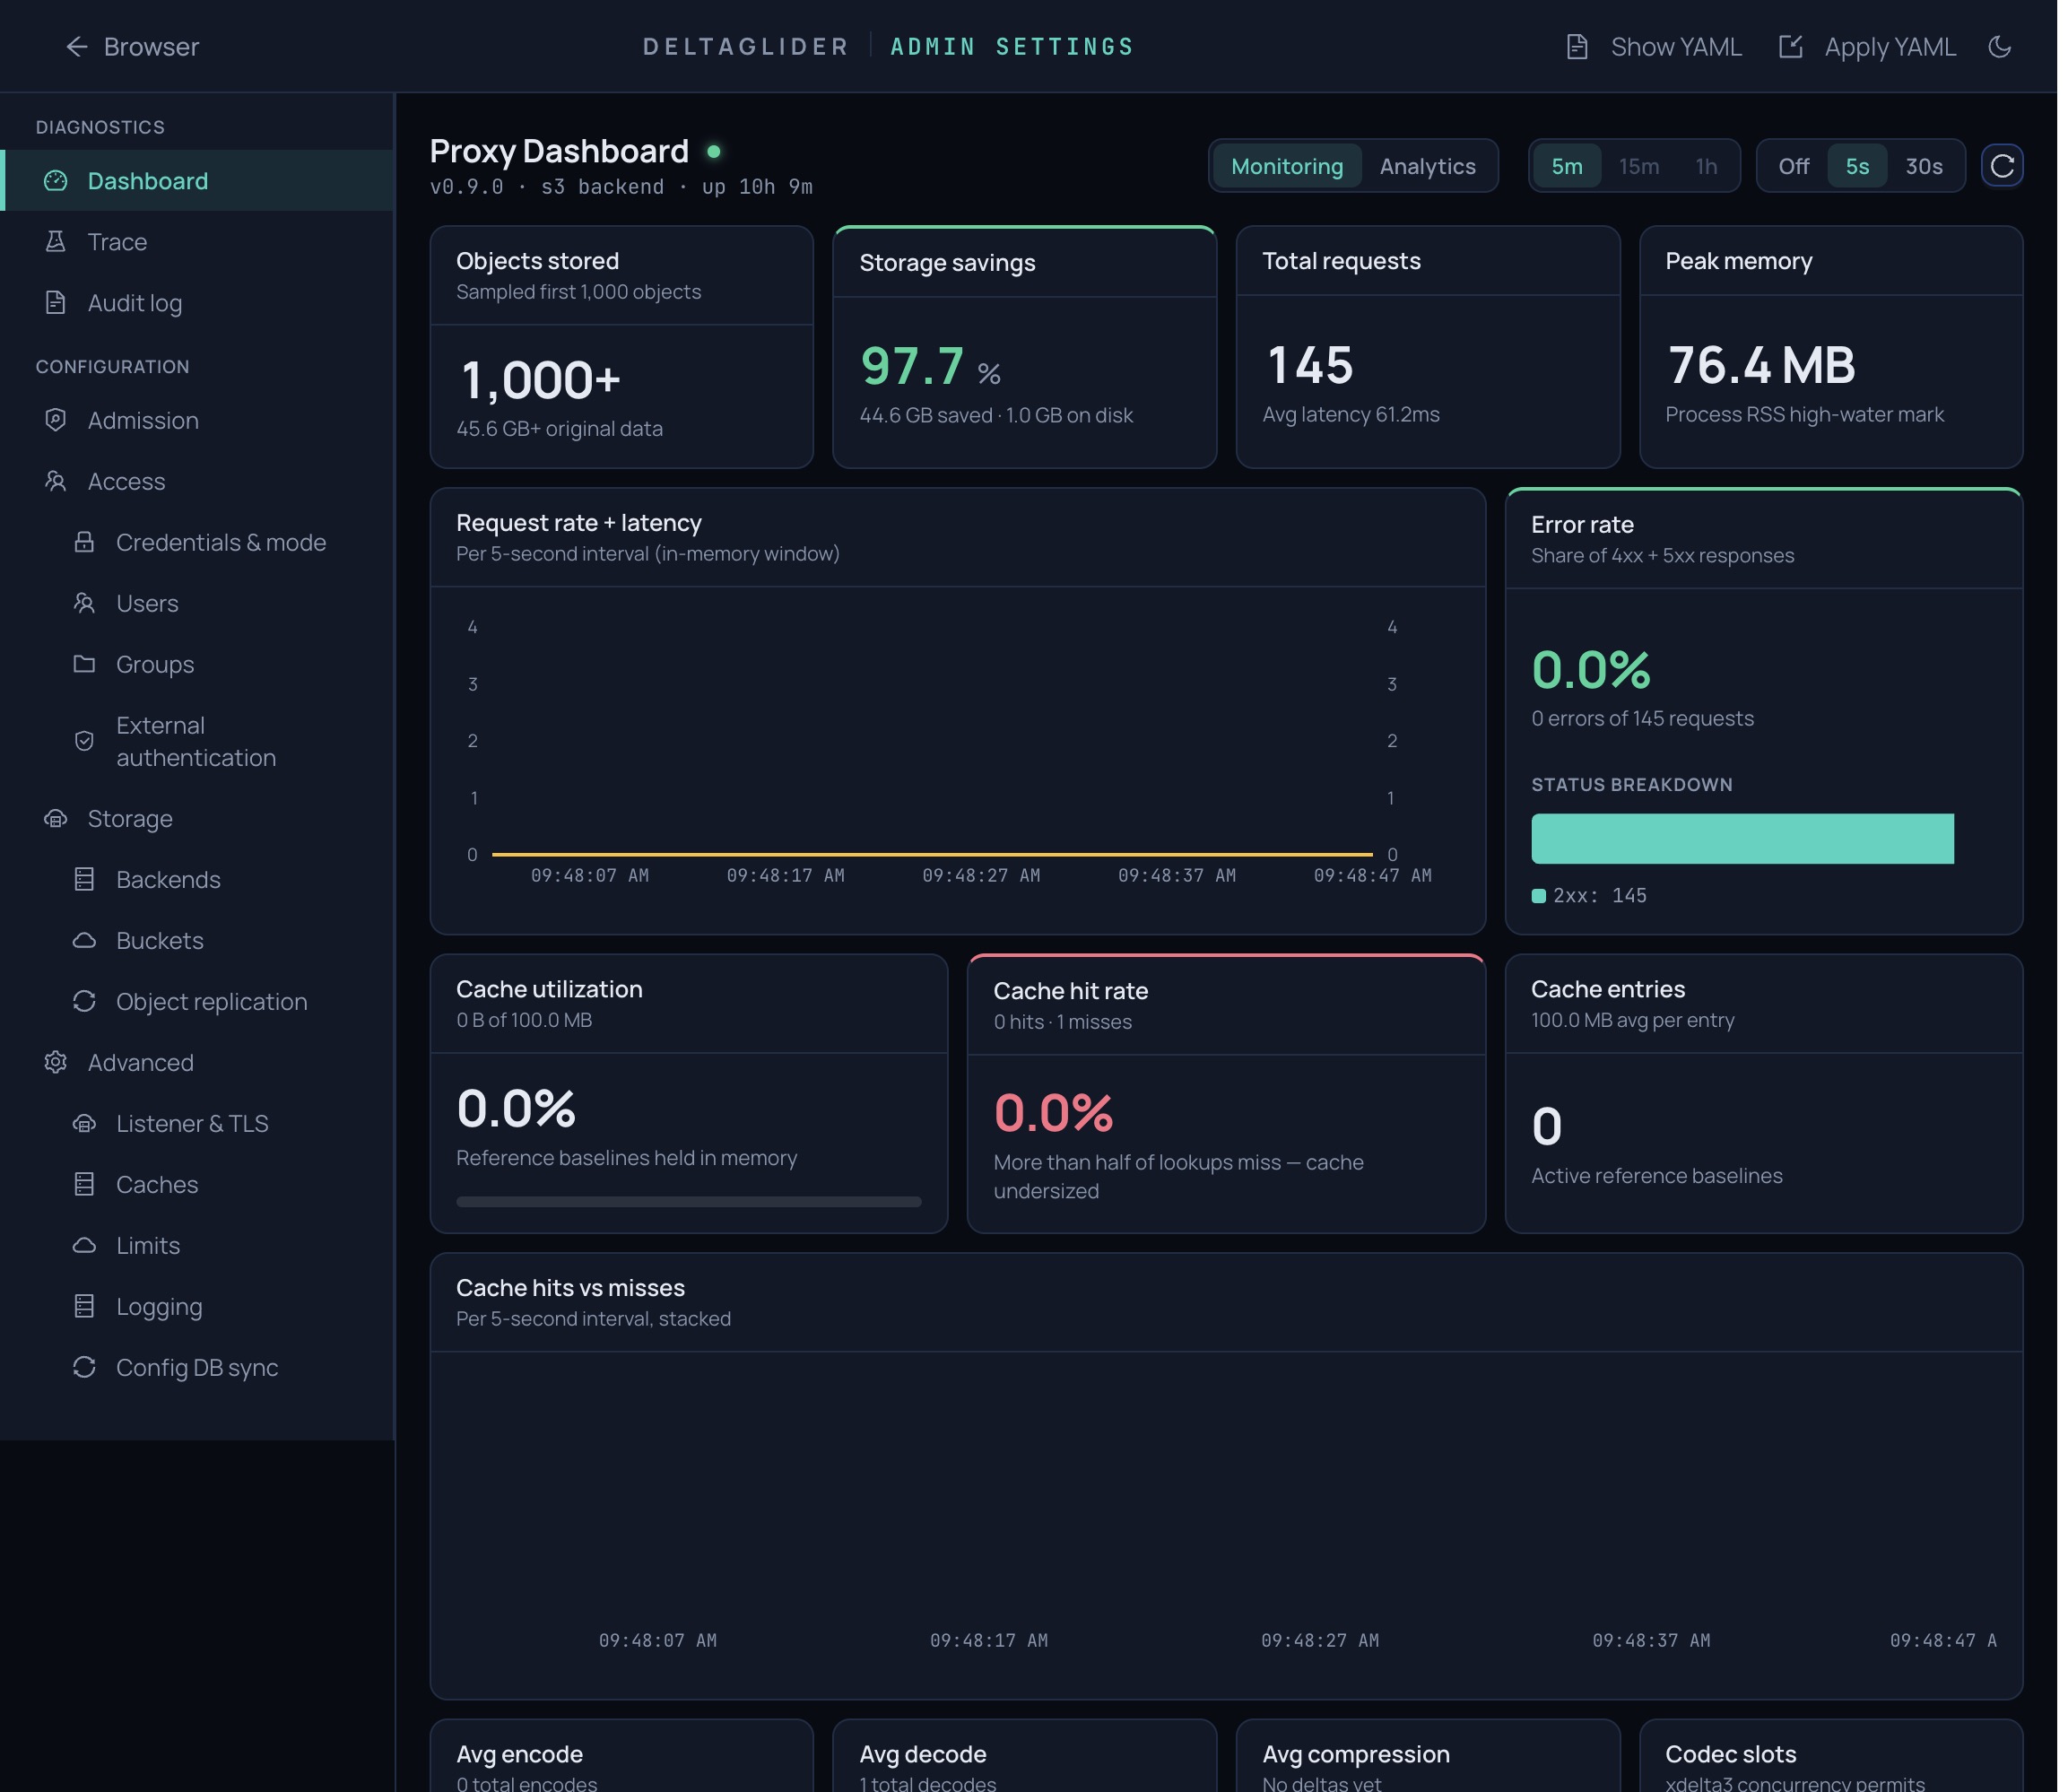
The admin UI ships a live monitoring page at /_/admin/dashboard — same metrics, auto-refreshed every 5s, with a storage-analytics tab that surfaces per-bucket savings and estimated cost. The Monitoring view leads with 9 headline KPIs; deeper codec/latency telemetry sits behind a default-closed "Detailed telemetry" toggle. It's not a substitute for Grafana in production (no historical retention, no alerting), but it answers "is the proxy healthy right now?" without leaving the UI.
Verify#
# The endpoint serves Prometheus text format
curl -s https://s3.acme.example/_/metrics | grep deltaglider_ | head

# Prometheus sees the target as up
curl -s 'http://localhost:9090/api/v1/query?query=up{job="deltaglider"}' | jq '.data.result[].value'
In Grafana, the request-rate panel should show data within one scrape interval of real traffic. To test the alert pipeline, stop the proxy and confirm DeltaGliderDown fires after 2 minutes.
Related#
- Metrics reference — full catalog, labels, buckets
- How to take a proxy to production — cache sizing and codec concurrency knobs
- Troubleshooting — symptom → metric mapping when something misbehaves